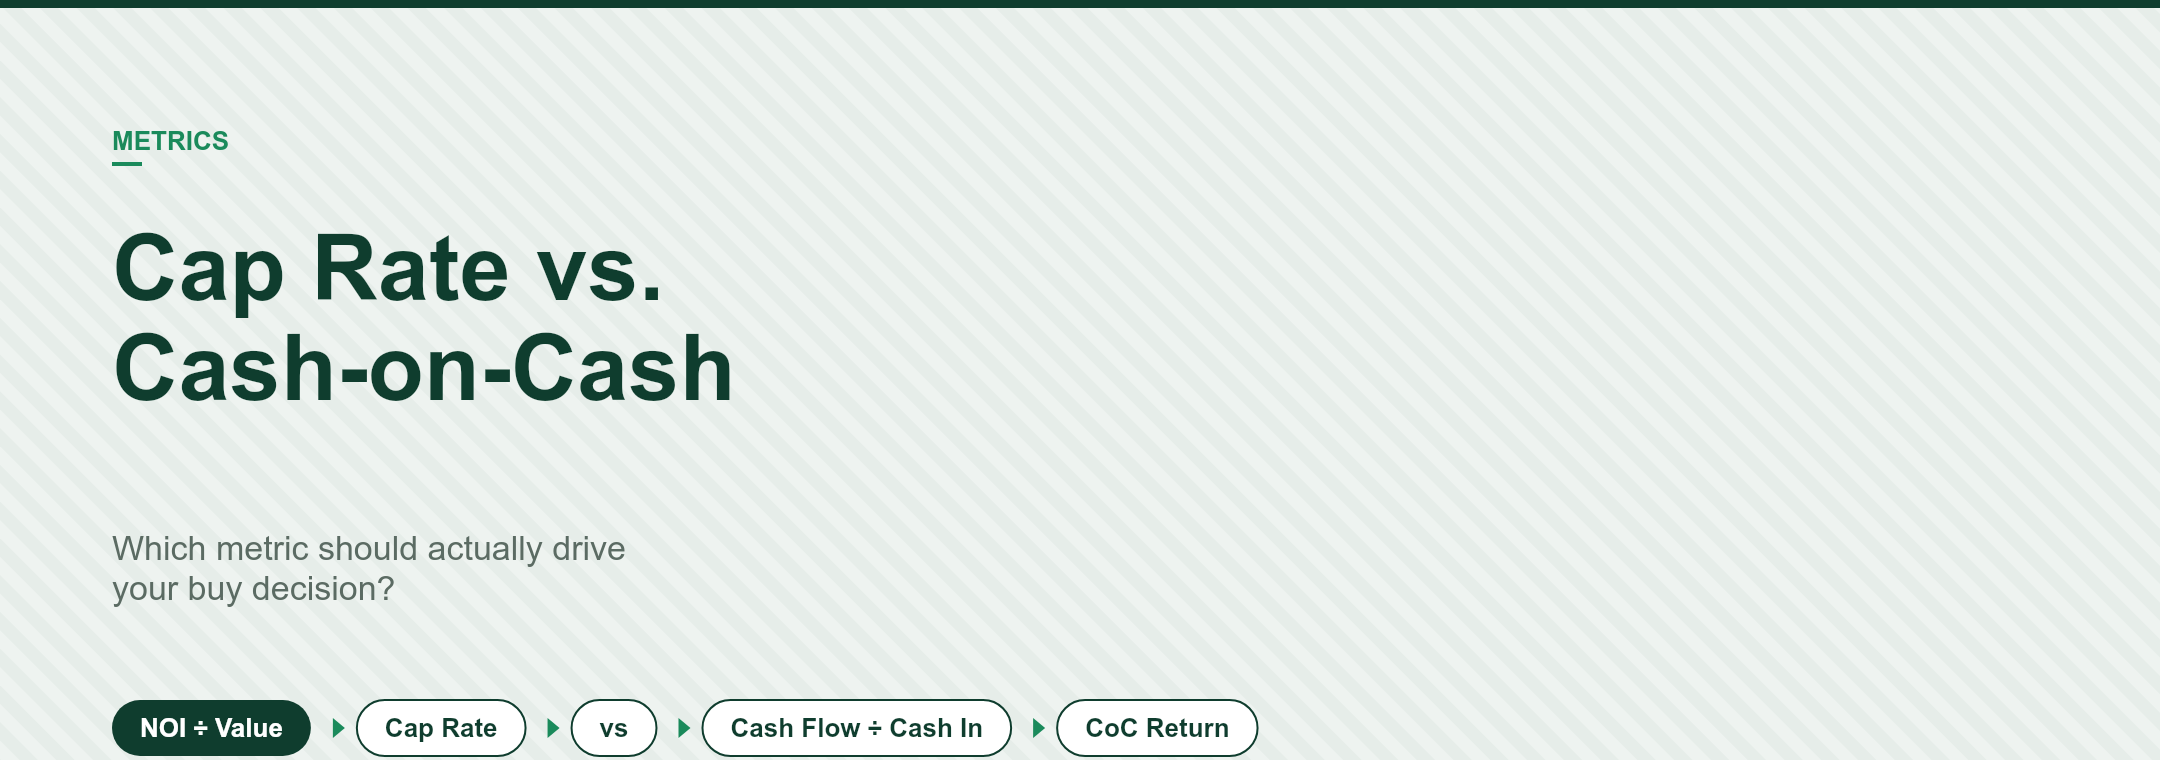
Cap Rate vs. Cash-on-Cash Return: Which Metric Actually Matters for Your Rental Property?
If you've spent more than five minutes researching rental properties, you've run into two numbers: cap rate and cash-on-cash return. Investors throw them around like they're interchangeable. They're not.
Both metrics measure profitability. But they answer different questions — and confusing them leads to bad deals.
This guide breaks down exactly what each number means, when to use it, and which one should actually drive your decision to buy.
What Is Cap Rate?
Cap rate (short for capitalization rate) measures a property's income potential as if you paid all cash — no mortgage.
The formula:
Cap Rate = Net Operating Income (NOI) ÷ Property Value
Net Operating Income is your gross rental income minus operating expenses. Operating expenses include property management fees, insurance, taxes, maintenance, and vacancy allowance. They do not include your mortgage payment.
Example:
- A duplex rents for $2,400/month ($28,800/year)
- Operating expenses total $10,000/year
- NOI = $18,800
- Purchase price = $235,000
- Cap rate = $18,800 ÷ $235,000 = 8.0%
A higher cap rate generally means more income relative to price — or more risk relative to a comparable asset. In hot markets, cap rates compress because buyers pay more for the same income. In slower markets, cap rates expand.
What Is Cash-on-Cash Return?
Cash-on-cash return (CoC) measures what you actually earn on the cash you personally put into a deal — after your mortgage payment.
The formula:
Cash-on-Cash Return = Annual Cash Flow ÷ Cash Invested
Annual cash flow is your NOI minus your annual mortgage payments. Cash invested is your down payment plus closing costs plus any upfront repairs.
Same duplex, financed:
- NOI: $18,800
- Annual mortgage payment (30yr at 7%): $14,100
- Annual cash flow: $4,700
- Cash invested: $47,000 (20% down) + $4,700 (closing) = $51,700
- Cash-on-cash return = $4,700 ÷ $51,700 = 9.1%
CoC reflects the real-world return on your money — which is why most active investors care about it more than cap rate.
The Key Difference
| | Cap Rate | Cash-on-Cash |
|---|---|---|
| Ignores financing? | ✓ Yes | ✗ No |
| Reflects your actual return? | ✗ No | ✓ Yes |
| Best for comparing markets? | ✓ Yes | ✗ No |
| Best for evaluating a specific deal? | ✗ No | ✓ Yes |
Cap rate is a market tool. It lets you compare properties across different financing scenarios and markets on an apples-to-apples basis. Institutional buyers and appraisers use it to value commercial property.
Cash-on-cash is an investor tool. It tells you what your actual money earns in the actual deal you're about to make.
When Cap Rate Is Useful
Cap rate shines when you're doing market-level analysis or comparing properties without worrying about your specific financing.
Use cap rate to:
- Compare markets. A 5% cap rate in Phoenix tells you something different than a 9% cap rate in Cleveland. You're comparing how those markets price income.
- Evaluate value. If similar properties in a neighborhood trade at 7% cap rates and you find one at 10%, something is wrong — or something is right.
- Skip the financing noise. If you're comparing a property you'd finance against one you'd buy in cash, cap rate lets you evaluate the underlying asset without the distortion.
- Work backward from value. If you know the market cap rate and the NOI, you can estimate what a property should be worth.
When Cash-on-Cash Return Is Useful
Cash-on-cash return is the number that determines whether a deal actually works for you — the real investor with a real mortgage.
Use CoC to:
- Evaluate a specific deal. You need to know if your $60,000 invested earns an acceptable return.
- Compare financing scenarios. A 25% down payment vs. 20% vs. a seller carry — all produce different CoC returns.
- Set a target before you analyze. Most experienced investors won't close a deal under 8–10% CoC. Knowing your target prevents you from falling in love with bad numbers.
- Justify the deal to partners or lenders. CoC is tangible. It's what your money earns, on paper and in practice.
A Common Mistake
Many new investors find a property with a great cap rate and assume it's a great deal. Then they finance it, do the real math, and discover the cash-on-cash return barely beats a savings account.
This happens because leverage works in both directions. Financing increases your CoC return when the cost of debt is lower than the cap rate. When mortgage rates rise above cap rates — as they did in 2022–2024 — the math inverts. You can buy a property with an 8% cap rate, finance it at 7.5%, and end up with negative cash flow.
Always run both numbers. Cap rate tells you about the asset. Cash-on-cash tells you about the deal.
Common Mistakes to Avoid
Leaving out vacancy. Most investors assume 100% occupancy. Assume 5–8% vacancy as an operating expense before you calculate NOI. Skipping this inflates your cap rate and leads you to overpay.
Forgetting CapEx. A roof, HVAC, and water heater are coming eventually. A realistic analysis sets aside $1,000–$2,000/year per unit for capital expenditures. Leaving this out inflates both cap rate and CoC.
Confusing gross rent multiplier with cap rate. GRM ignores expenses entirely. It's a quick filter, not an analysis tool. Don't make buy decisions based on it.
Using list price instead of purchase price. Always calculate cap rate against the price you'll actually pay — or the price you're considering offering. List price is the seller's number. Your analysis needs your number.
What Good Numbers Look Like
There's no universal target. What counts as a "good" cap rate or CoC return depends on your market, your strategy, and your risk tolerance.
General benchmarks:
- Cap rate: 5–7% in strong, high-demand markets; 8–11% in secondary and tertiary markets
- Cash-on-cash return: Most buy-and-hold investors target 8–12% minimum; higher is always better
If a deal can't hit your minimum CoC target at a realistic purchase price, it's not the right deal — or not the right market.
How ProfitTrackr Handles Both
ProfitTrackr calculates cash-on-cash return automatically on every deal you analyze. Enter your purchase price, financing terms, estimated rents, and expenses, and you'll see CoC return, monthly cash flow, and an Investment Score in seconds.
No spreadsheet formulas. No manual math. No wondering if you got the calculation right.
If you're evaluating multiple properties in different markets, the Compare feature lets you see key metrics side-by-side — so you can find the deal that actually works for you, not just the one with the best-looking cap rate on paper.
The Bottom Line
Cap rate and cash-on-cash return are both useful. Neither one alone tells the full story.
Cap rate helps you evaluate assets and markets without the noise of financing. Cash-on-cash return tells you what your money actually earns in the specific deal in front of you.
Investors who understand both — and use both at the right moment — make better decisions and avoid deals that look good on paper but bleed cash in the real world.
Run the cap rate to understand the market. Run the cash-on-cash return to understand the deal. Buy on the second number.
ProfitTrackr automatically calculates cash-on-cash return, monthly cash flow, and your Investment Score for every property you analyze. Start your free analysis →